BPI-Pico-S3 has the same dimension as the Raspberry Pi Pico board, equipped with an ESP32S3 chip, an 8MB flash, 4-layer PCB, electroplated half-hole process, ceramic antenna, supports 2.4 GHz Wi-Fi and Bluetooth® LE dual-mode wireless communication, it’s a development board perfect for IoT development and Maker DIY Projects.
TinyUF2 + CircuitPython is built-in at the factory.
It is recommended to use Mu Editor to get started with CircuitPython development.
YouTube
Banana Pi BPI-PicoW-S3 OLED real-time animation display of dual-axis joystick position[#CircuitPython]
Hardware interface
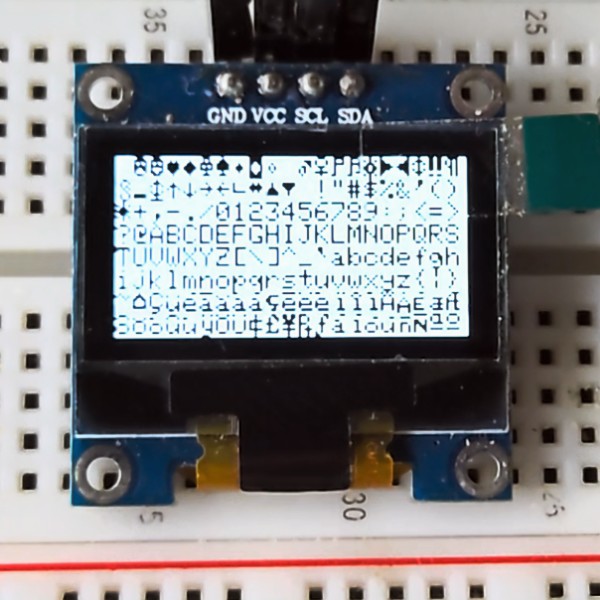
OLED real-time animation display of dual-axis joystick position
Based on the previous chapters :
BPI-PicoW-S3 Download and install the CircuitPython library to drive the ssd1306 oled display module BPI-PicoW-S3 Use a dual-axis joystick[CircuitPython]
A program can be designed to make the OLED real-time animation display the position of the dual-axis joystick.
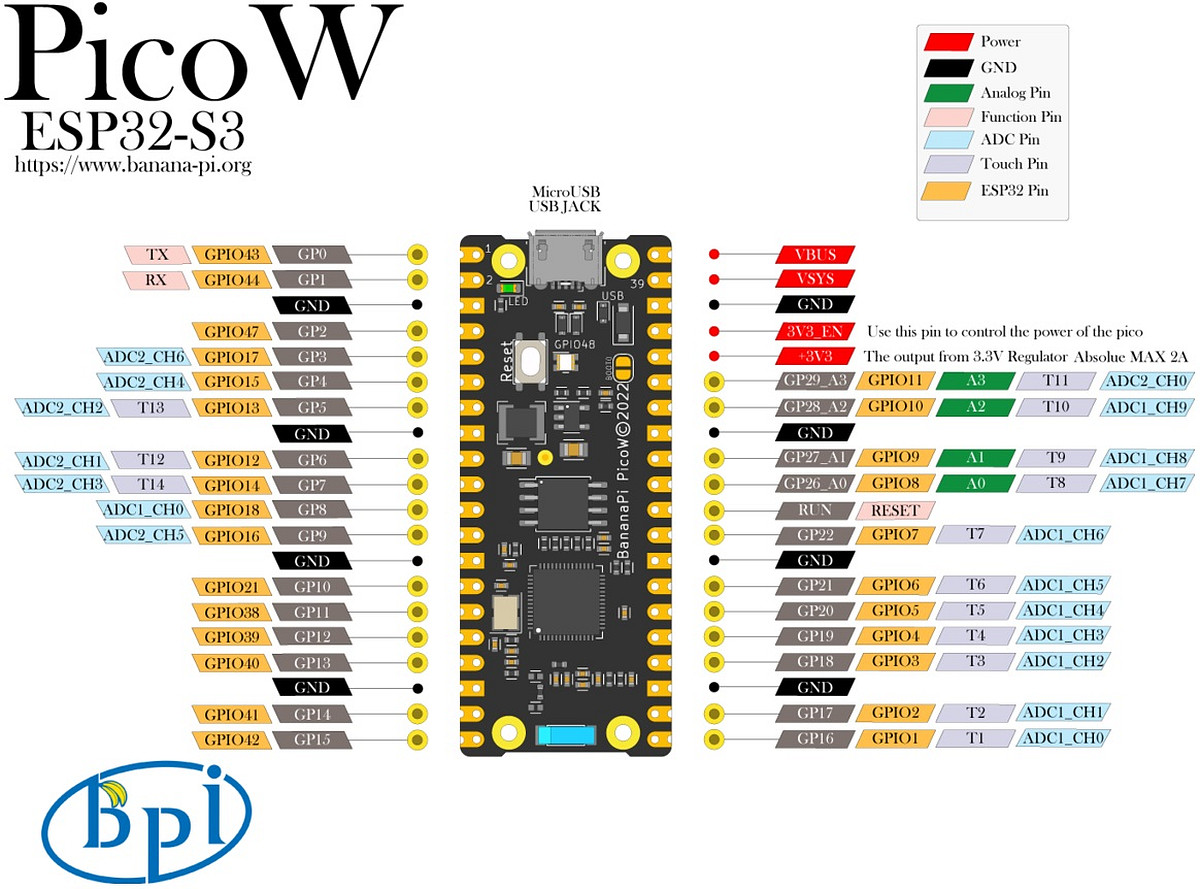
Wiring Reference
| ssd1306 | BPI-PicoW-S3 |
|---|---|
| GND | GND |
| VCC | 3V3 |
| SCL | GP0 |
| SDA | GP1 |
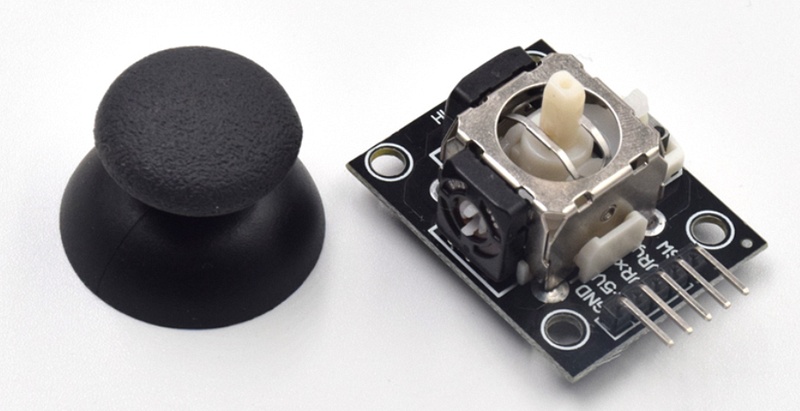
| Joystick | BPI-PicoW-S3 |
|---|---|
| GND | GND |
| +5V | 3V3 |
| VRx | GP27_A1 |
| VRy | GP26_A0 |
import time
import board
import busio
import analogio
import adafruit_ssd1306

def get_zero(times =500, sleep = 0.01):
    x_total = 0
    y_total = 0
    for i in range (times):
        x_axis = x_axis_pin.value
        y_axis = y_axis_pin.value
        x_total += x_axis
        y_total += y_axis
        time.sleep(sleep)
    x_zero = x_total // times
    y_zero = y_total // times
    return (x_zero,y_zero)

def get_extremum(times =500, sleep = 0.01):
    x_list = []
    y_list = []
    for i in range (times):
        x_axis = x_axis_pin.value
        y_axis = y_axis_pin.value
        x_list.append(x_axis)
        y_list.append(y_axis)
        time.sleep(sleep)
    x_extremum = (min(x_list),max(x_list))
    y_extremum = (min(y_list),max(y_list))
    return (x_extremum,y_extremum)

def get_spacing(level = 16 , zero =(32767,32767) ,x_extremum = (0,65535),y_extremum = (0,65535)):
    x_temp_1 = (zero[0] - x_extremum[0]) // level
    x_temp_2 = (x_extremum[1] - zero[0] ) // level
    y_temp_1 = (zero[1] - y_extremum[0]) // level
    y_temp_2 = (y_extremum[1] - zero[1] ) // level
    x_spacing = (x_temp_1,x_temp_2)
    y_spacing = (y_temp_1,y_temp_2)
    return (x_spacing,y_spacing)

def get_coordinates(zero = (32767,32767), x_spacing = (2048,2048),y_spacing = (2048,2048)):
    x_value = x_axis_pin.value - zero[0]
    y_value = y_axis_pin.value - zero[1]
    if x_value >= 0:
        x_axis = x_value // x_spacing[1]
    else:
        x_axis = - ((-x_value) // x_spacing[0])
    if y_value >= 0:
        y_axis = y_value // y_spacing[1]
    else:
        y_axis = - ((-y_value) // y_spacing[0])
    return (x_axis,y_axis)

# i2c init
i2c = busio.I2C(board.GP0, board.GP1)
display = adafruit_ssd1306.SSD1306_I2C(128, 64, i2c, addr=0x3C)

# Uniformly set the color and background color of displayed characters or graphics.
# Monochrome OLEDs only need to set one and then negate the other.
display_color = 0
bg_color = not display_color

# Fill background color.
display.fill(bg_color)
display.show()

# Set 2-axis rocker pin.
x_axis_pin = analogio.AnalogIn(board.A0)
y_axis_pin = analogio.AnalogIn(board.A1)

# Calibrate the zero point.
# Take the xy-axis reading when the dual-axis joystick is at rest and set it to zero point.
display.text('Zero adjustment', 0, 20, display_color, font_name='font5x8.bin', size=1)
display.text('Do not touch', 0, 28, display_color, font_name='font5x8.bin', size=1)
display.show()
zero = get_zero(times =200, sleep = 0.01)
display.text('Do not touch', 0, 28, bg_color, font_name='font5x8.bin', size=1)
str_zero = "x={},y={}".format(zero[0],zero[1])
display.text(str_zero, 0, 28, display_color, font_name='font5x8.bin', size=1)
display.show()
print(str_zero)
time.sleep(2)

# Different hardware measures different extreme values.
display.fill(bg_color)
display.text('Extremum adjustment', 0, 20, display_color, font_name='font5x8.bin', size=1)
display.text('Rotary rocker', 0, 28, display_color, font_name='font5x8.bin', size=1)
display.show()
(x_extremum,y_extremum) = get_extremum(times = 400, sleep = 0.01)
display.text('Extremum adjustment', 0, 20, bg_color, font_name='font5x8.bin', size=1)
display.text('Rotary rocker', 0, 28, bg_color, font_name='font5x8.bin', size=1)
str_x_extremum = "x_min={},x_max={}".format(x_extremum[0],x_extremum[1])
str_y_extremum = "y_min={},y_max={}".format(y_extremum[0],y_extremum[1])
display.text(str_x_extremum, 0, 20, display_color, font_name='font5x8.bin', size=1)
display.text(str_y_extremum, 0, 28, display_color, font_name='font5x8.bin', size=1)
print((str_x_extremum, str_y_extremum))
display.show()
time.sleep(2)

# Setting the scale spacing can eliminate unnecessary jitter.
(x_spacing,y_spacing) = get_spacing(level = 32 , zero = zero, x_extremum = x_extremum,y_extremum = y_extremum)
print((x_spacing, y_spacing))

display.fill(bg_color)
display.text('x=', 70, 16, display_color, font_name='font5x8.bin', size=2)
display.text('y=', 70, 32, display_color, font_name='font5x8.bin', size=2)
(x_axis,y_axis) = (0,0)
(x_axis_1,y_axis_1) = (1,1)
(x_axis_2,y_axis_2) = (0,0)
display.show()
while True:
    # Get the coordinate value in a loop.
    (x_axis,y_axis) = get_coordinates(zero = zero, x_spacing = x_spacing, y_spacing = y_spacing)
    # Only refresh the display when the coordinates change.
    if (x_axis,y_axis) == (x_axis_1,y_axis_1):
        pass
    else:
        # Using background color inversion for identical pixels,
        # pixels can be refreshed with minimal performance cost.
        display.fill_rect(x_axis_2-3, y_axis_2-3, 6, 6, bg_color)
        display.text(str(x_axis_1), 90, 16, bg_color, font_name='font5x8.bin', size=2)
        display.text(str(y_axis_1), 90, 32, bg_color, font_name='font5x8.bin', size=2)
        (x_axis_1,y_axis_1) = (x_axis,y_axis)
        (x_axis_2,y_axis_2) = (x_axis+32, -y_axis+32)
        display.fill_rect(x_axis_2-3, y_axis_2-3, 6, 6, display_color)
        display.text(str(x_axis_1), 90, 16, display_color, font_name='font5x8.bin', size=2)
        display.text(str(y_axis_1), 90, 32, display_color, font_name='font5x8.bin', size=2)
        display.show()
BPI-PicoW-S3 + CircuitPython Tutorial Aggregation Link
BUY BPI-PicoW-S3 :
-
OEM&OEM customized service: [email protected]