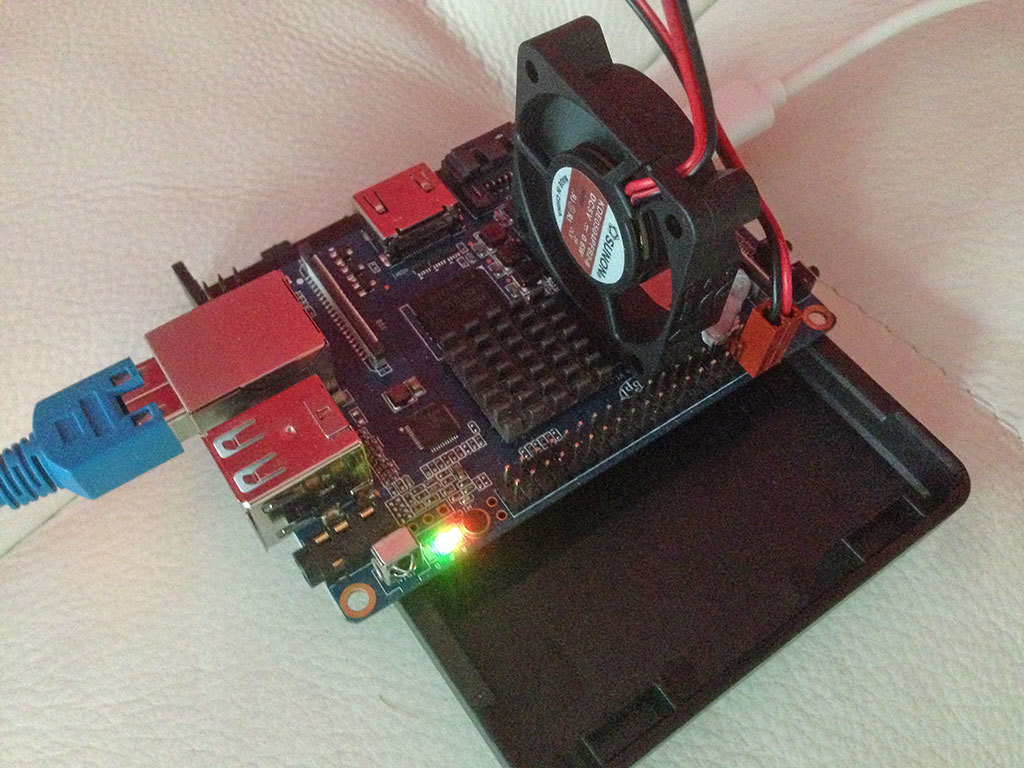
First Average load and task performance are directly proportioonal on any multi core system. These processors also have a vector unit for each set of 4 cores. You make use of the processor more fully when the load is high. If your load number is low you are not stressing the processor completely.
Many of the single thread benches are attached to single processor instead of available threads. Minerd works this way each runner watches a specific processor for ready before accepting the next task. You will not get a very good utilization doing this. Stress-NG works the same roughly sysbench will make use of the cueing and vector units if you set the process count to 48-64 you will see a trim in the time necessary to do the task. Finally the tasks need to be written to be aggressive themselves an easy way to do that is to loop while a file exists and kill themselves when the file is missing. This way you can launch 64 workers at the same time the workers will also make use of the cache and the look aside in the processor. Parallel allows a simple perl script to launch subshells until the process is done.
CPU-RAM.sh is progressively brutal as it makes the hex code then folds it and searches the cache file before writing and stopping. If entropy is low the task takes forever due to duplicates in the cache file. If entropy is high the script still has to search a variable length up to 10,000 line file.
SO in real world this is the same as doing a pre shared key lookup on an encrypted channel. This is not a public key but two separate keys that are compared on both ends on each packet. Both the client and the server have a random group of pre shared tokens 100 users 100 keys each and packets are keyed with these codes. Each server instance 8 per A83T supports the encryption for 100 users. Or in more practice use 6 cores for encryption 2 cores for other uses.
Charles you are missing three files from the logs.
graph.svg
Heatsink.log
The last few lines of the autosevo report are also missing.
It should have indicated on standard out the watts dissipated by cooling device and the total time for cpu-ram1 and cpu-ram2
I can see in Temperature.csv That you reached peak load at 73 load 2017-06-21.08.38.37 and began throttling.
At 2017-06-21.08.47.17 you dropped to 480mhz and remained in overheat at 1.6Ghz and it looks like you lost a couple of cores. Load also dropped to @40
Looking at the Temperature.csv I can see that you throttled and dropped cores and frequency.
Make sure you have gnu plot installed it was part of the standard base LSB if not installed will not create graph.
Please install gnu plot and rerun I am curious to see the graph.
And what was the heatsink rating in watts?
Curious that your report is missing those lines and the graph.
Also you may want to learn who I am and where I have been. Your comments about what you know to be true are drawn from books I and my friends have written. I started at Penn State in 1968 at the ChiChester campus of the Wistar Institute. They delivered the very first hard drive to our lab in 1971.
The original Point to Point over Ethernet was developed by myself and 2 others at Bell Telephone in 1993. I am the author of the Afghan, Pakistan, Punjab telephone system. And I was one of the owners of Frontier Telecom.
I created Subka for Mubaric in Egypt and Think Wifi in Pakistan. I have run telephone systems into Cuba, Jamaica, Nicaragua, Punjab, NWFP Pakistan, Kabul Jalalabad Afghanistan. I owned Creative Marketing Impact who was the marketing company for Banana Boat, Pananma Jack, Sea & Ski and 20 others. I designed and marketed children’s toys including Blues Clues, Dora The Explora, Sega Sonic the Hedge Hog , Fischer Price Little People and mr & ms Potato head. In 2007 I built myself number 76 in the top 500 computers. I designed and built the electrical system for the Archistrat RockCity the first computer to run faster than 1Ghz. I have designed wrote and run several bitcoin pools one producing 30 coins per day.
If you ask you may learn if you argue you are nothing more than a troll.
 ).
).


