Perf record does not seem to work, is the device tree with the wrong information?

a simple perf record fails

$ perf record ls
perf.data  perf.data.old
[ perf record: Woken up 1 times to write data ]
[ perf record: Captured and wrote 0.001 MB perf.data ]
$ perf report
Error:
The perf.data data has no samples!

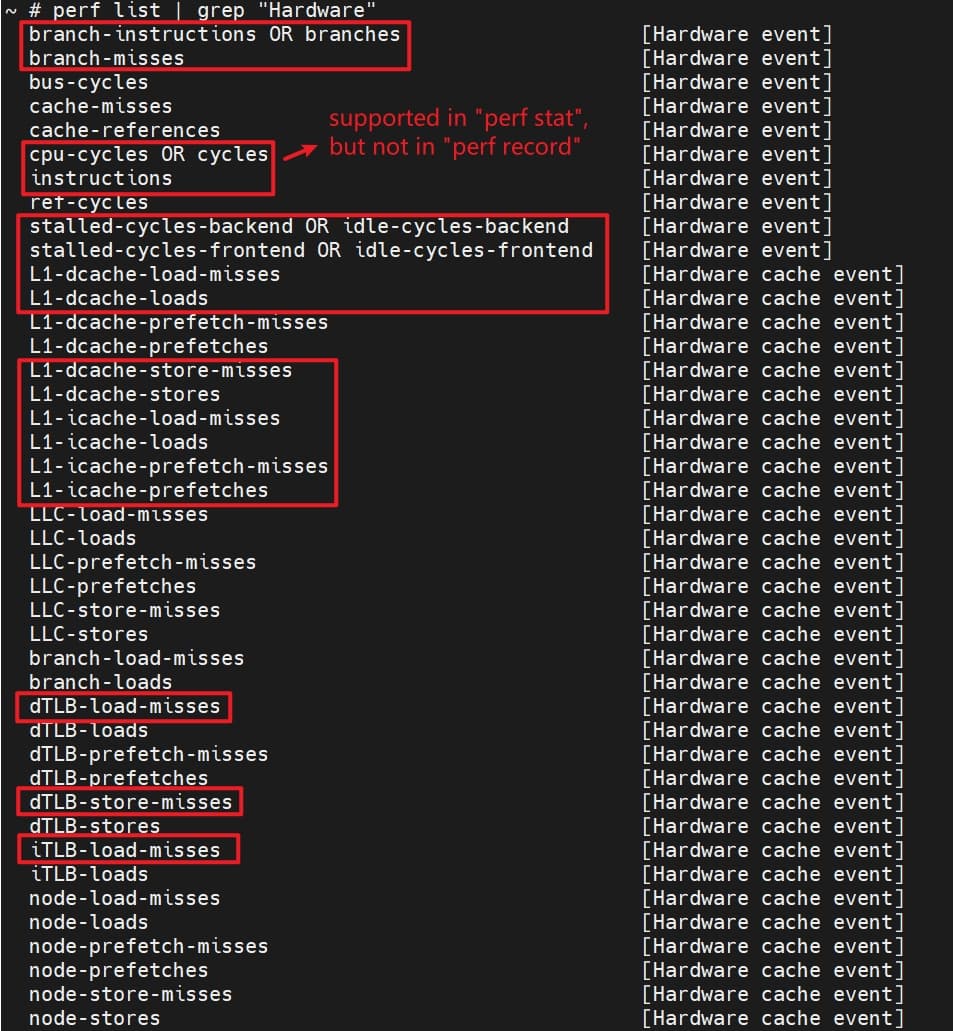
perf list reports what it looks correct

perf list | grep Hardware
  branch-instructions OR branches                    [Hardware event]
  branch-misses                                      [Hardware event]
  bus-cycles                                         [Hardware event]
  cache-misses                                       [Hardware event]
  cache-references                                   [Hardware event]
  cpu-cycles OR cycles                               [Hardware event]
  instructions                                       [Hardware event]
  ref-cycles                                         [Hardware event]
  stalled-cycles-backend OR idle-cycles-backend      [Hardware event]
  stalled-cycles-frontend OR idle-cycles-frontend    [Hardware event]
  mem:<addr>[/len][:access]                          [Hardware breakpoint]

But none of those events lead to samples

May I know which source code you used, please? and how did you install the perf ?

I used the 6.8 perf, should I build perf from the provided linux sources?

I used also the perf sources coming from linux-6.1.15-k1 and it does not work the same way.

F3 cannot support linux perf

why the kernel provided has support for it?

[    4.486711] riscv-pmu-sbi: SBI PMU extension is available
[    4.495544] riscv-pmu-sbi: 16 firmware and 18 hardware counters

Actually F3 supports linux perf. This perf record issue occurs because it samples “cycles” event by default. RISC-V sscofpmf extension doesn’t specify the counter overflow interrupt of mcycle/minstret, which the “cycles”/“instructions” event sampling depends on.

If you use other events, e.g. “perf record -e branches”, it will work.

BTW, not all the events reported by perf list are supported. It supports the following events:

Thank you, that explains the puzzling results. I’m confused since on other risc-v hardware I have access to I do not see that problem. Do you have more information about it? Not having cycles or instruction counts makes perf record much less useful so would be nice to see if it can be fixed.

I know little about other RISC-V hardware, but I noticed QEMU supports counting cycles/instructions by not only mcycle/minstret but also mhpmevent/mhpmcounter, so it can provide counter overflow interrupt for cycles/instructions. Perhaps other RISC-V hardware uses similar implementations. It’s a pity that the K1 chip on F3 doesn’t implement this, so it seems that it cannot be fixed.

Maybe you can consider the following two workarounds:

  • use software events (such as cpu-clock or task-clock) instead.

  • build perf from the provided linux sources. The sources in tools/perf/pmu-events/arch/riscv/spacemit/x60 define some hardware-specific event names, which of all support sscofpmf and can be used directly by perf user. There may be some substitute events, e.g. u_mode_cycle/s_mode_cycle/m_mode_cycle.

I tried already to build the perf sources from there, but with no change in the output, I guess it is time to dig a bit more in the code. :slight_smile:

If everything goes well, perf list can show the hardware-specific events:

  branch-instructions OR branches                    [Hardware event]
  branch-misses                                      [Hardware event]
  bus-cycles                                         [Hardware event]
  cache-misses                                       [Hardware event]
  cache-references                                   [Hardware event]
  cpu-cycles OR cycles                               [Hardware event]
  instructions                                       [Hardware event]
// Other predefined events...

// These are K1 specific events
branch:
  br_inst
       [Branch instructions]
  br_mispred
       [Branch mispredictions]
  cond_br_inst
       [Conditional branch instructions]
  cond_br_mispred
       [Conditional branch mispredictions]
  indirect_br_inst
       [Indirect branch instructions]
  indirect_br_mispred
       [Indirect branch mispredictions]
  long_jump
       [Long jumps]
  taken_br_mispred
       [Taken branch mispredictions]
  taken_cond_br_inst
       [Taken conditional branch instructions]
  taken_cond_br_mispred
       [Taken conditional branch mispredictions]
  uncond_br_inst
       [Unconditional branch instructions]
  uncond_br_mispred
       [Unconditional branch mispredictions]
// More other hardware-specific events...

Which perf are you using to get that list? neither perf from 6.8 vanilla nor the perf from the provided 6.1.15 sources show that.

I forgot to run jevents.py, now I have them :slight_smile: